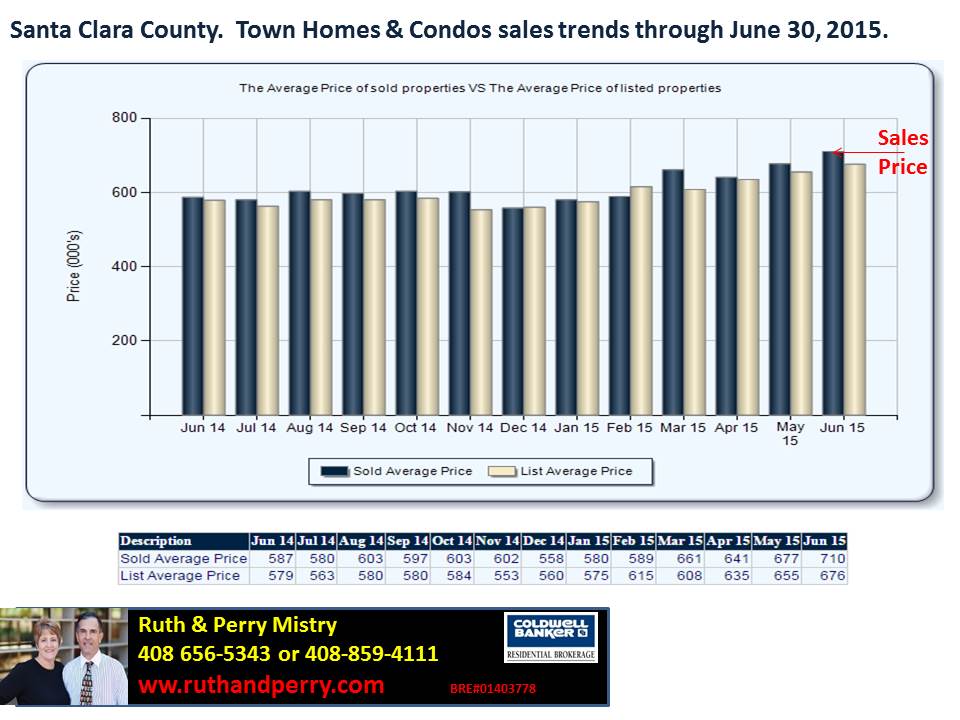
Santa Clara County Town Home and Condo Sales.


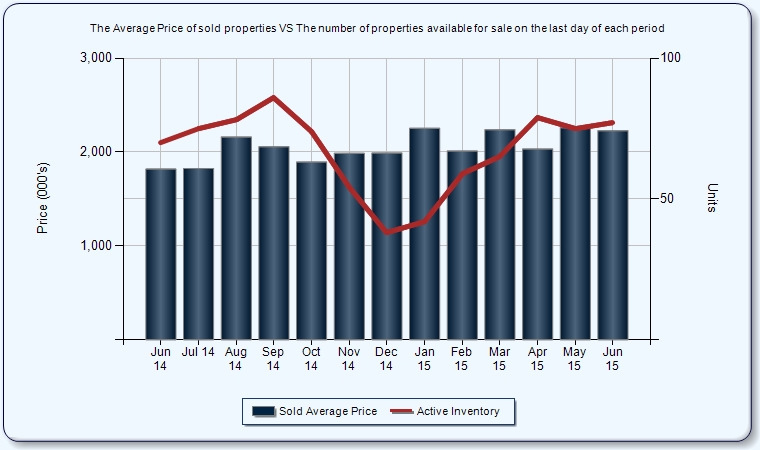
Los Gatos Single Family Home Sales Trends:


| Description | Jun 14 | Jul 14 | Aug 14 | Sep 14 | Oct 14 | Nov 14 | Dec 14 | Jan 15 | Feb 15 | Mar 15 | Apr 15 | May 15 | Jun 15 |
|---|---|---|---|---|---|---|---|---|---|---|---|---|---|
| Sold Average Price | 1,818 | 1,825 | 2,161 | 2,055 | 1,893 | 1,986 | 1,988 | 2,253 | 2,010 | 2,237 | 2,032 | 2,259 | 2,227 |
| Active Inventory | 70 | 75 | 78 | 86 | 74 | 54 | 38 | 42 | 59 | 65 | 79 | 75 | 77 |
| Description | Jun 14 | Jul 14 | Aug 14 | Sep 14 | Oct 14 | Nov 14 | Dec 14 | Jan 15 | Feb 15 | Mar 15 | Apr 15 | May 15 | Jun 15 |
|---|---|---|---|---|---|---|---|---|---|---|---|---|---|
| Sold Average Price | 1,818 | 1,825 | 2,161 | 2,055 | 1,893 | 1,986 | 1,988 | 2,253 | 2,010 | 2,237 | 2,032 | 2,259 | 2,227 |
| List Average Price | 2,185 | 2,565 | 2,091 | 2,553 | 2,281 | 2,371 | 2,660 | 2,760 | 2,817 | 2,444 | 2,377 | 2,082 | 2,748 |
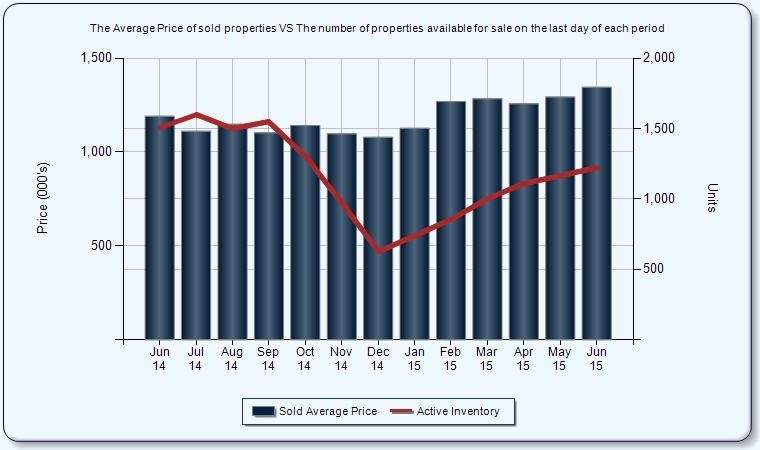
Santa Clara County, single family home sales trends for
12 months.

| Description | Jun 14 | Jul 14 | Aug 14 | Sep 14 | Oct 14 | Nov 14 | Dec 14 | Jan 15 | Feb 15 | Mar 15 | Apr 15 | May 15 | Jun 15 |
|---|---|---|---|---|---|---|---|---|---|---|---|---|---|
| Sold Average Price | 1,190 | 1,111 | 1,148 | 1,102 | 1,141 | 1,097 | 1,079 | 1,127 | 1,269 | 1,284 | 1,257 | 1,293 | 1,345 |
| Active Inventory | 1,504 | 1,600 | 1,496 | 1,549 | 1,302 | 976 | 626 | 740 | 851 | 1,003 | 1,108 | 1,165 | 1,223 |
